
What’s Power BI?
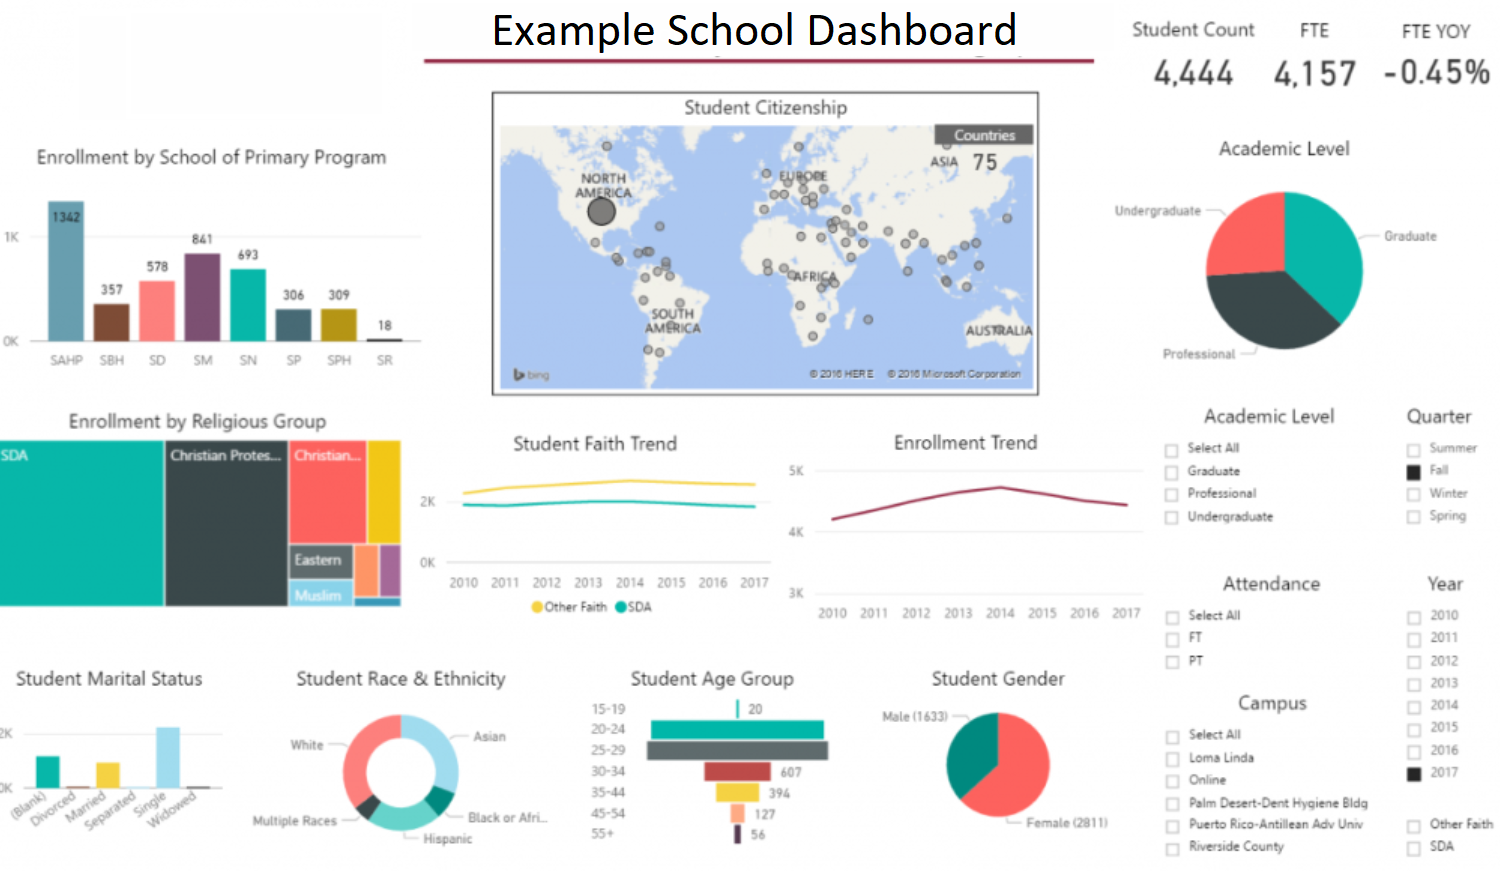
Microsoft Power BI is a Business Intelligence tool designed to allow data feeds from many sources to come together into an easy dynamic dashboard. The dashboard consists of a number of reports designed by an administrator and published onto the internet for consumers to use. If you imagine the graphs from excel spreadsheets all linked together for the user to interrogate however they like without any training – that is Power BI
My MIS has analytical data, why is this useful to me?
Usually your MIS only holds part of the story, it may hold your student data but not your financial data or your marketing data, Power BI lets you bring together many live feeds of data into one place. Also many MIS systems are setup in isolation, making it challenging to gather aggregated data in a group across a number of schools.
Sounds interesting, how much does it cost?
Creating Reports and Dashboards is free, if you want to publish then to the web then each user that wishes to access them must have a Power BI Pro licence which at the time of writing is around $9.99 USD per month.
https://powerbi.microsoft.com/en-us/pricing/
Ok I’m in!, how do I do it?
This guide explains how to setup a Power BI Dashboard for your school group without your servers being on the same network/domain without needing any real technical expertise.
In this guide I detail the steps to achieve this in your own group using Capita SIMS MIS and Microsoft One Drive, however with a little adaptation it would be very easy to achieve the same result using another MIS and GoogleDrive.
If you are struggling with any of the steps in the guide below, please feel free to reach out for some help: l.drury@live.co.uk
The 10 Steps of Process
- STEP 01 – Create an O365 account with a PowerBI Pro licence to be your “Master O365” account and ensure it is secure (i recommend 2 factor authentication)
- STEP 02 – Create a basic O365 account for each school site within your group, this only need minimal free licence, as long as it has some cloud storage in OneDrive.
- STEP 03 – Create a folder in the one drive of each school O365 account called [SCHOOL NAME]-Data-Export and share it will full administrator rights to the Master O365 account.
- STEP 04 – Install OneDrive Local Sync on your MIS server and sign in with the schools O365 account, creating a local synced copy of the Data-Export folder on the MIS server.
- STEP 05 – Create a script to extract data from your MIS into a csv and save it into the Data-Extract folder, this will auto sync to the cloud and allow the O365 Master account to access the data.
- STEP 06 – Create a scheduled task on the MIS server to run the script however regular your desire the data top be updated.
- STEP 07 – Download and install PowerBI Desktop on your device and sign in using your master O365 Master account.
- STEP 08 – Create a PowerBI data source from each of the csv data files taken from each of the cloud synced csv files from each school.
- STEP 09 – Create an append query to create a master data table with data from all schools combined into one.
- STEP 10 – Create and publish your PowerBI analysis based on the combined table, allowing you a full group view of all your data.
Step 1 & 2 – Account Creation
Ask your IT team to create an O365 account for each school. For ease of scripting I would recommend a solid naming convention e.g.
- dulwich-dataservice-shanghai
- dulwichdataservice-beijing
And for security purposes I would recommend a different password for each account so if one became compromised it wouldn’t affect all schools. You also need them to create a master account for you that will hold all the data together, and publish the PowerBI desktop – this needs to have the additional PowerBI Pro licence.
Step 3 & 4 – Server Folder Sync
Login to OneDrive from your SIMS server for your first school and create a folder called Data-Export-SCHOOLNAME in the OneDrive Folder.
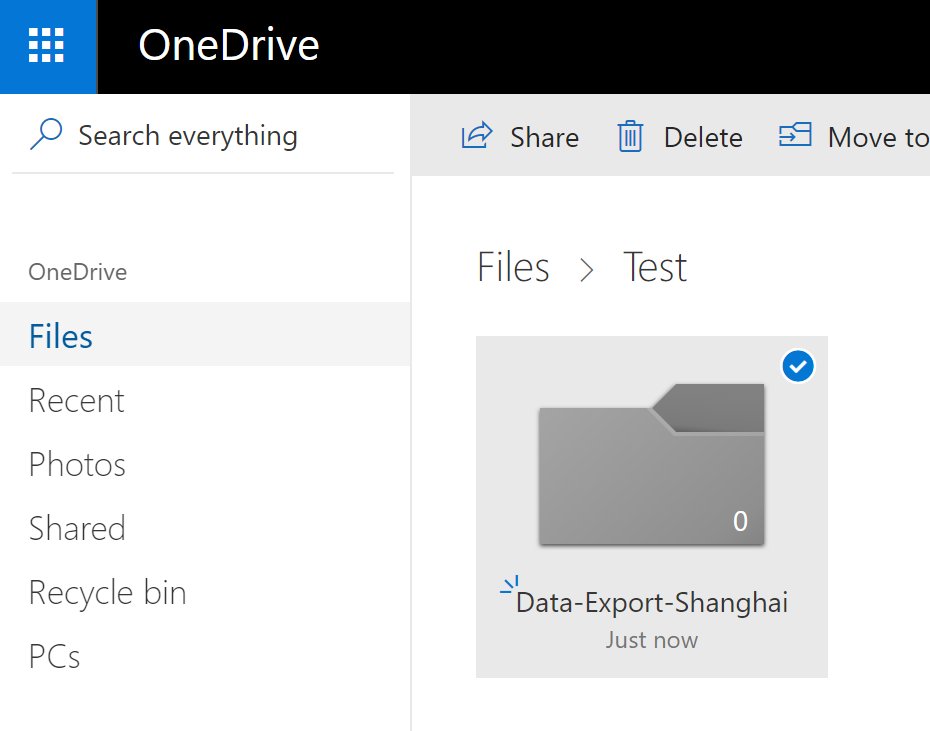
Share this folder fully with your master account.

Now click on “Sync” icon on your toolbar, this will prompt the download of the local sync tool onto your MIS server. Follow the wizard through to completion.
This service will create and sync your data export folder you just created with the local server and the cloud (which is shared with the master account) – Anything placed in this folder will be available online to the master account.
Step 5 – Create a script to extract data from your MIS
You need to get your MIS data into a .csv file format and saved within the cloud synced folder. This can be achieved very easily with SIMS using the instructions in the command reporter user guide below:
You should save your script into your Data-Export-SCHOOLNAME folder – this will allow you to make any data additions remotely without having to access school servers each time.
Step 6 – Create a Scheduled Task

You need to setup a scheduled task on your sims server to run your extraction script from the Data-Export-SCHOOLNAME folder – this should be set to run as often as you want the data to update.
To setup a scheduled task on your sims server you can follow the instructions in the Microsoft guide here: https://docs.microsoft.com/en-us/windows/desktop/taskschd/task-scheduler-start-page
Do be careful that you ensure enough time between extractions to export the data from sims and for the sync service to upload the new file to the cloud before running the next update or you will get into a mess of different version of the files trying to upload and locked files causing the system to fail.
Step 7 – Download Power BI Desktop
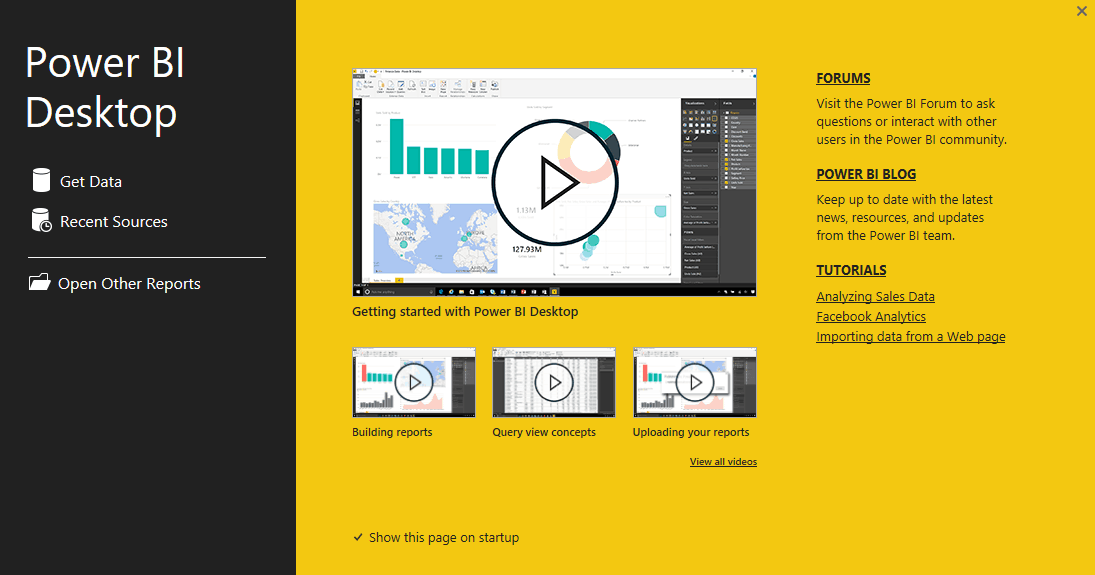
You can install this on your own device it doesn’t have to be on a server, but do ensure you login using the Master account which has access to all the data sources across your group rather than your own O365 login.
Download: https://powerbi.microsoft.com/en-us/desktop/
Step 8 – Connect to each individual data files in Power BI
This is a link to a brilliant guide on how to add your data files in the Master OneDrive account as live links: https://docs.microsoft.com/en-us/power-bi/desktop-use-onedrive-business-links
That means that when your script updates the data on the SIMS server and it uploads it to the cloud your Power BI dashboards will receive it.
Step 9 – Create an Append Query to consolidate data
Once you have added your individual data sources it will look something like this below, with a separate data source for each school:
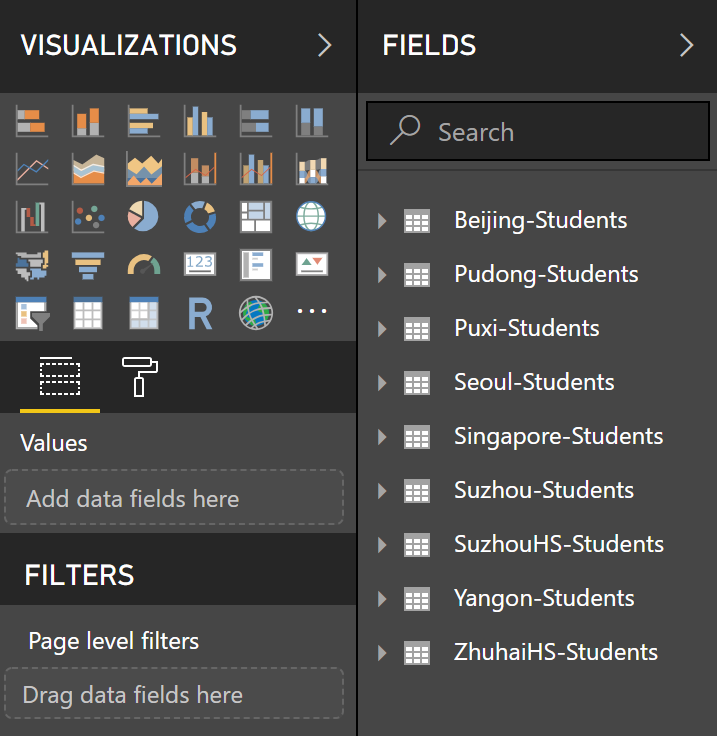
By creating an append query with all tables we can combine all the data together into one table, allowing us to easily interrogate the data. Use this guide to create an append query: https://docs.microsoft.com/en-us/power-bi/desktop-shape-and-combine-data
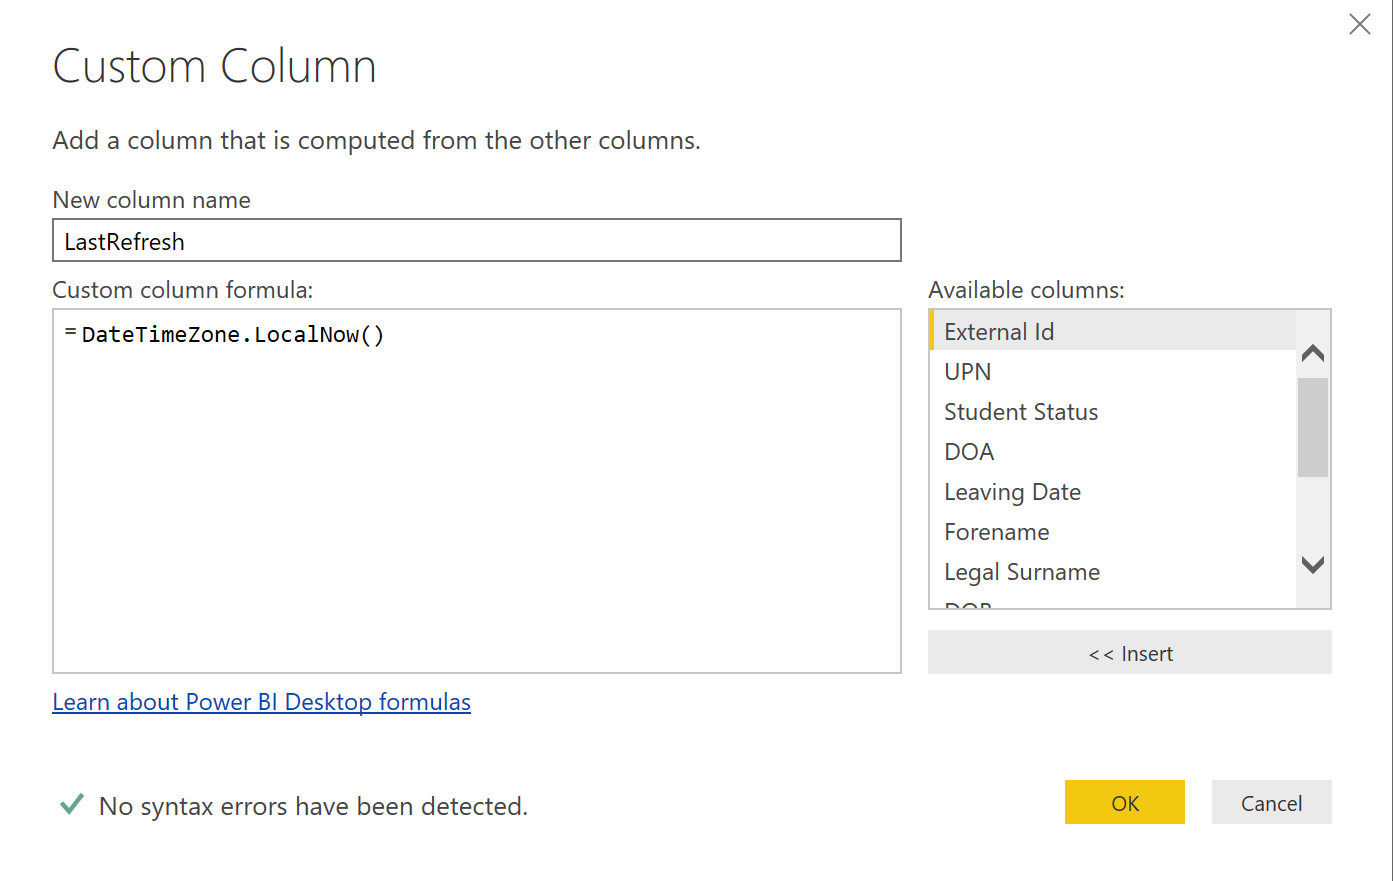
By adding a custom column with a formula to the append query you can capture when the data was last updated, this is very useful to add to your Power BI Dashboard as a “Card” to allow the user to see when the snapshot was taken and for your own testing purposes to check its all working. The formula i use is shown below:
Step 10 – Design & Publish the Dashboards
I am not going to re-invent the wheel and write a guide to using Power BI Desktop to publish dashboard to a website – there are loads of resources already on the internet, The Microsoft site is a good starting place: https://powerbi.microsoft.com/en-us/learning/
